
 Español
  Deutsch
  Français
 The platform
The whole model, not the summary.
One login, every listed company: the accounts, a valuation you can question, risk measured properly, and the week’s market in context.
- 38,000+
- companies
- Listed worldwide, with accounts and valuation for each one.
- 9,700+
- ETFs
- With full holdings and a screener to choose.
- 60+
- markets
- The Americas, Europe and Asia, in one place.
- 30 years
- of history
- Price and fundamental series to see the whole cycle.
What is inside
Search and coverage
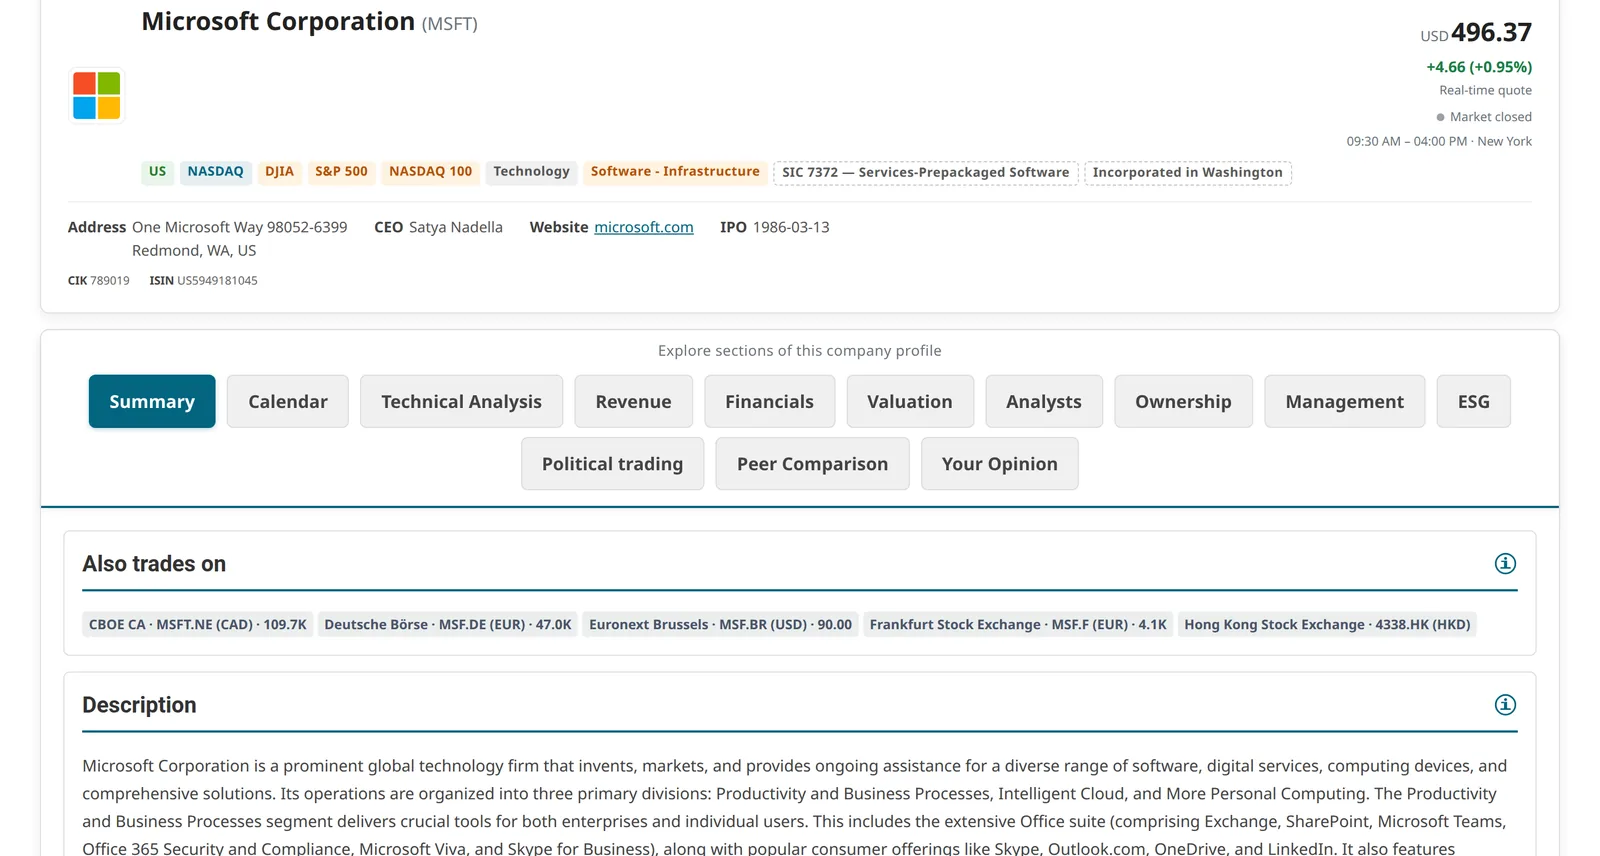
Type a name and land on the full picture: profile, price, filings, peers. Companies, ETFs, indexes, currencies and commodities, across the world’s markets.
Fundamentals
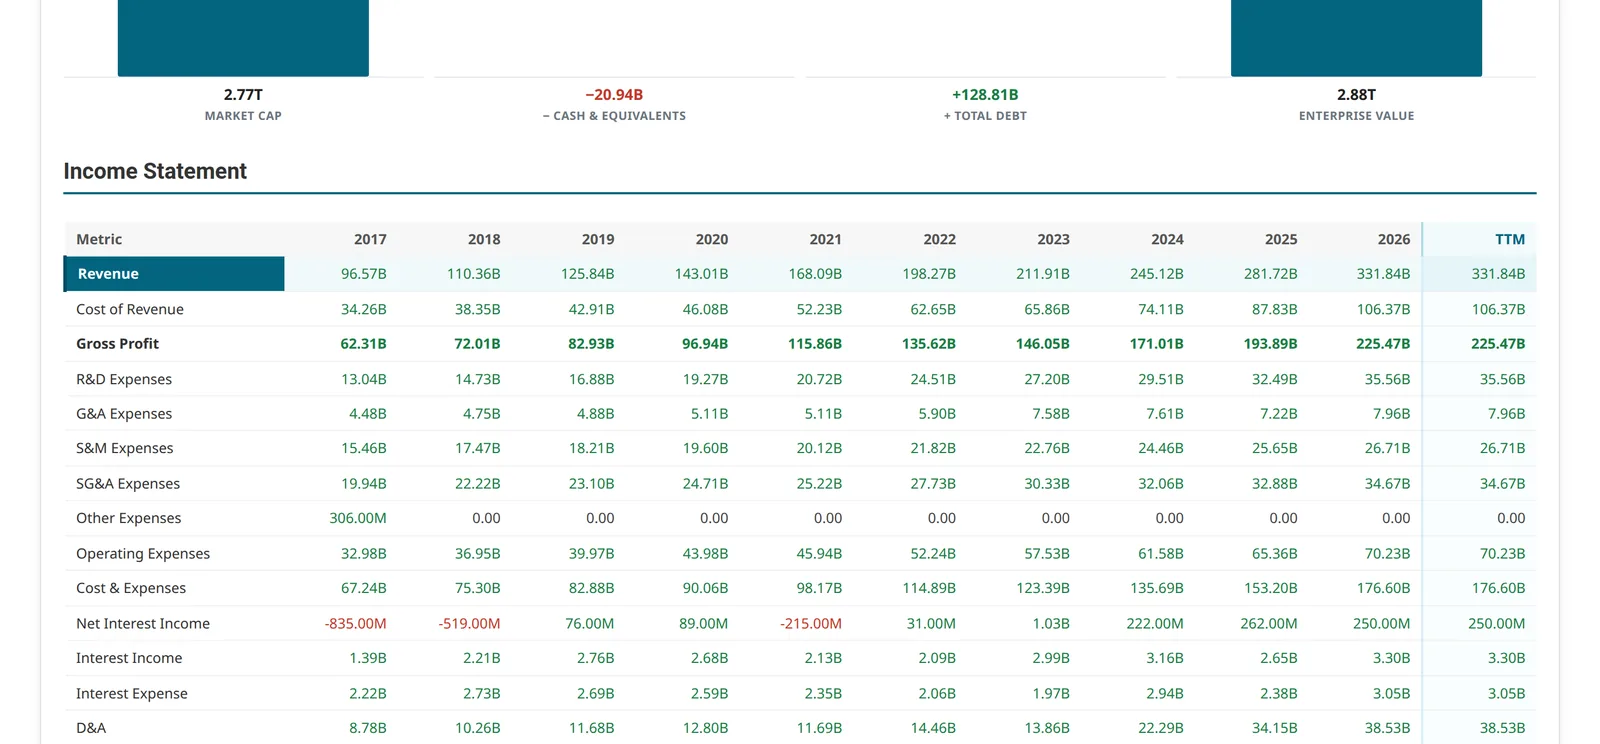
Income statement, balance sheet and cash flow, with segments, ownership and insider activity next to them. Years of history, quarter by quarter.
Valuation
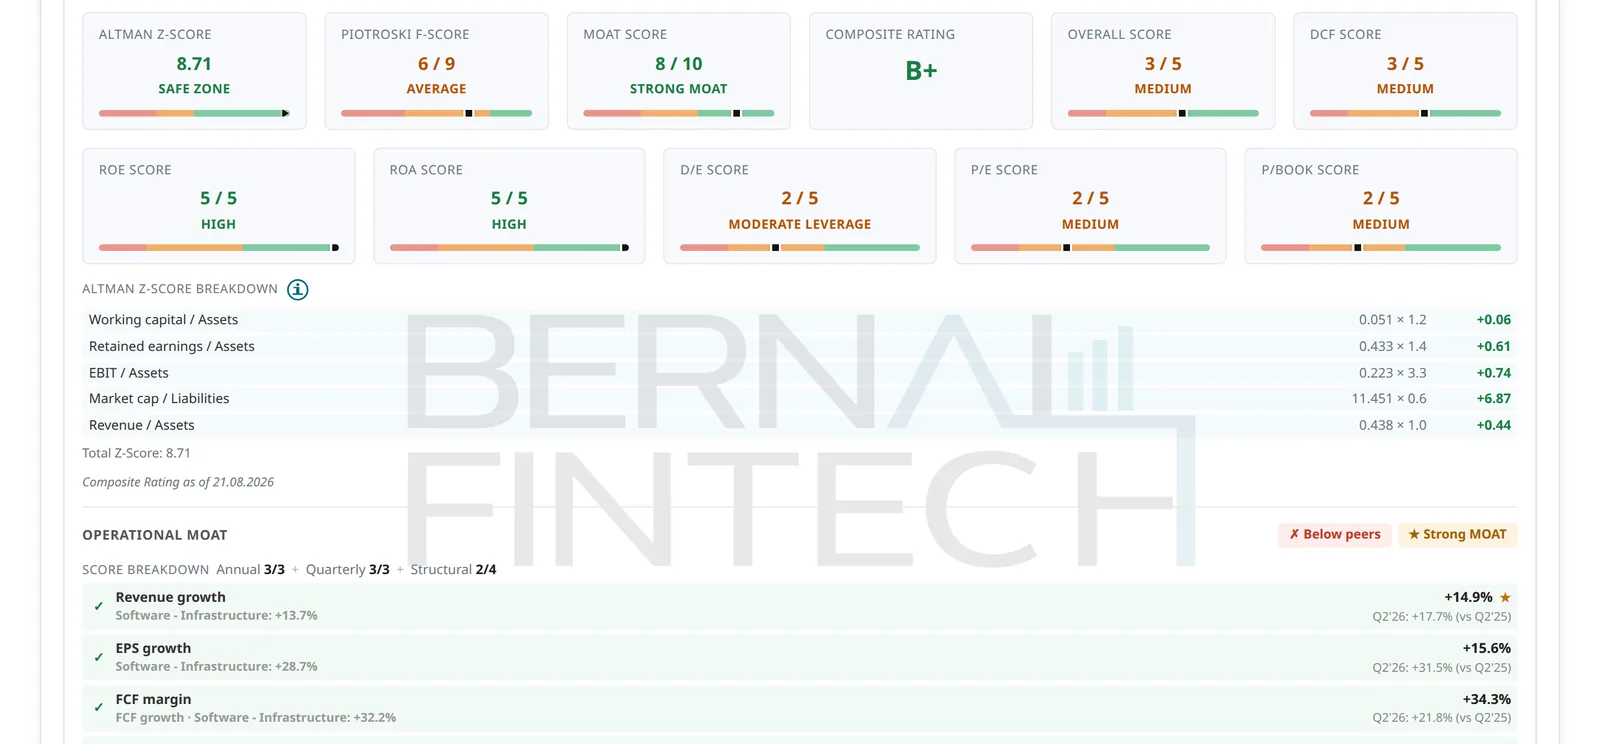
A DCF you drive: change the assumptions and watch the price react. Owner Earnings next to the reported figure, so the quality of the profit is visible.
Risk
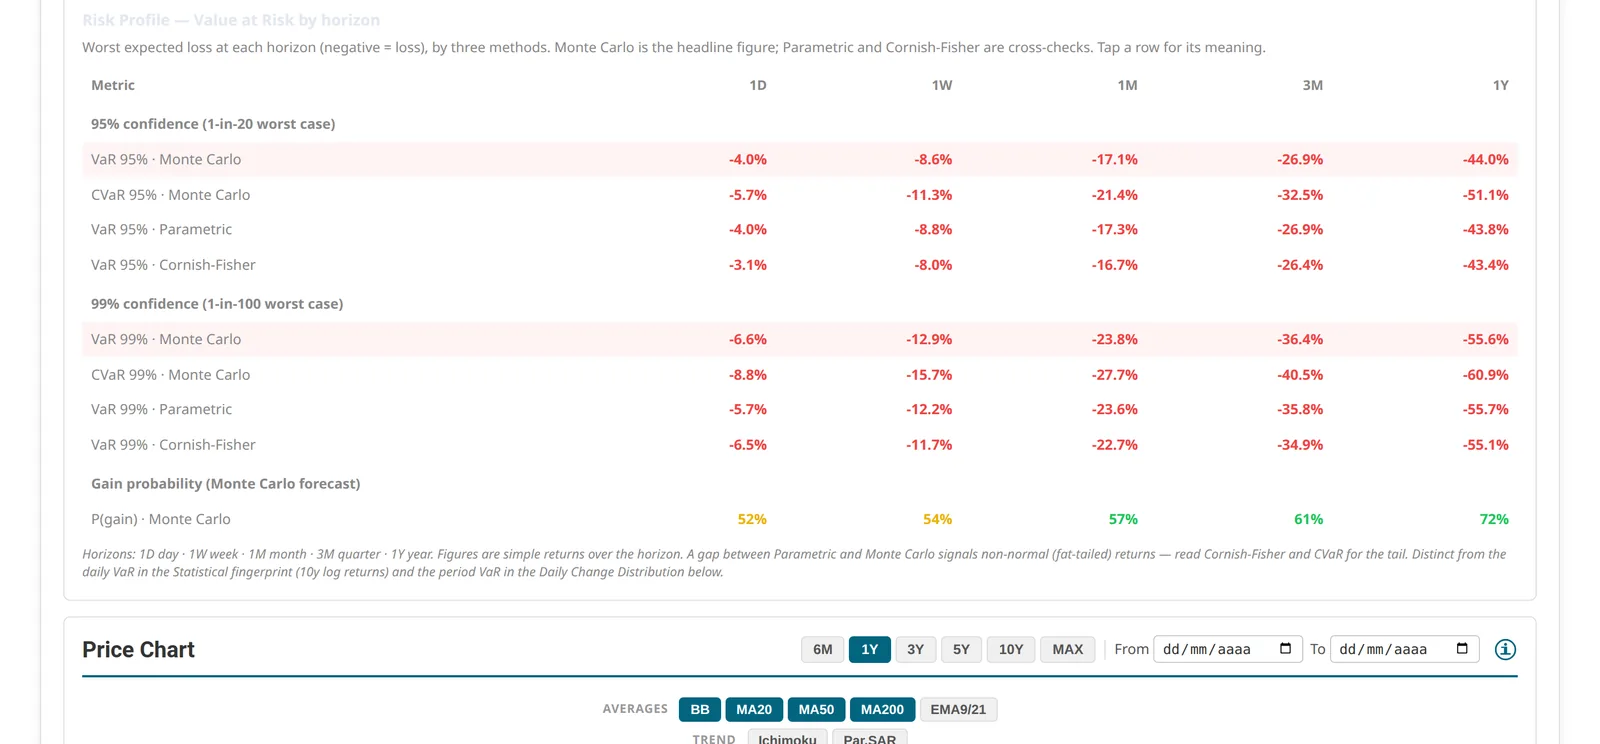
VaR, CVaR, GARCH, Monte Carlo, Markov chains and Hurst — measured on every company, with the assumptions in the open. Distributions, not a single number.
Technical
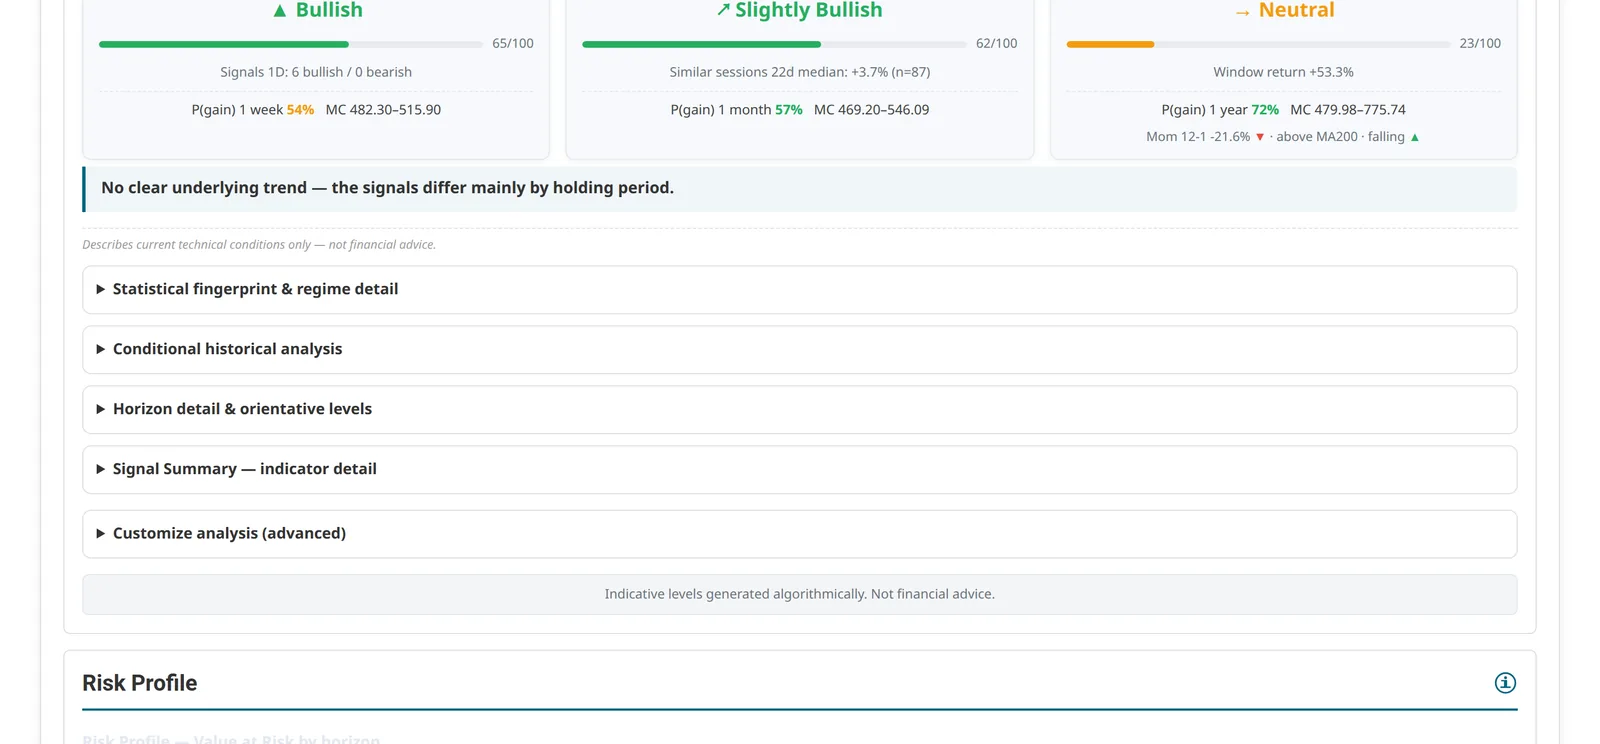
Three horizons with a conviction score, Volume Profile included. The rules are visible: you can check why a signal says what it says.
Sectors and ETFs
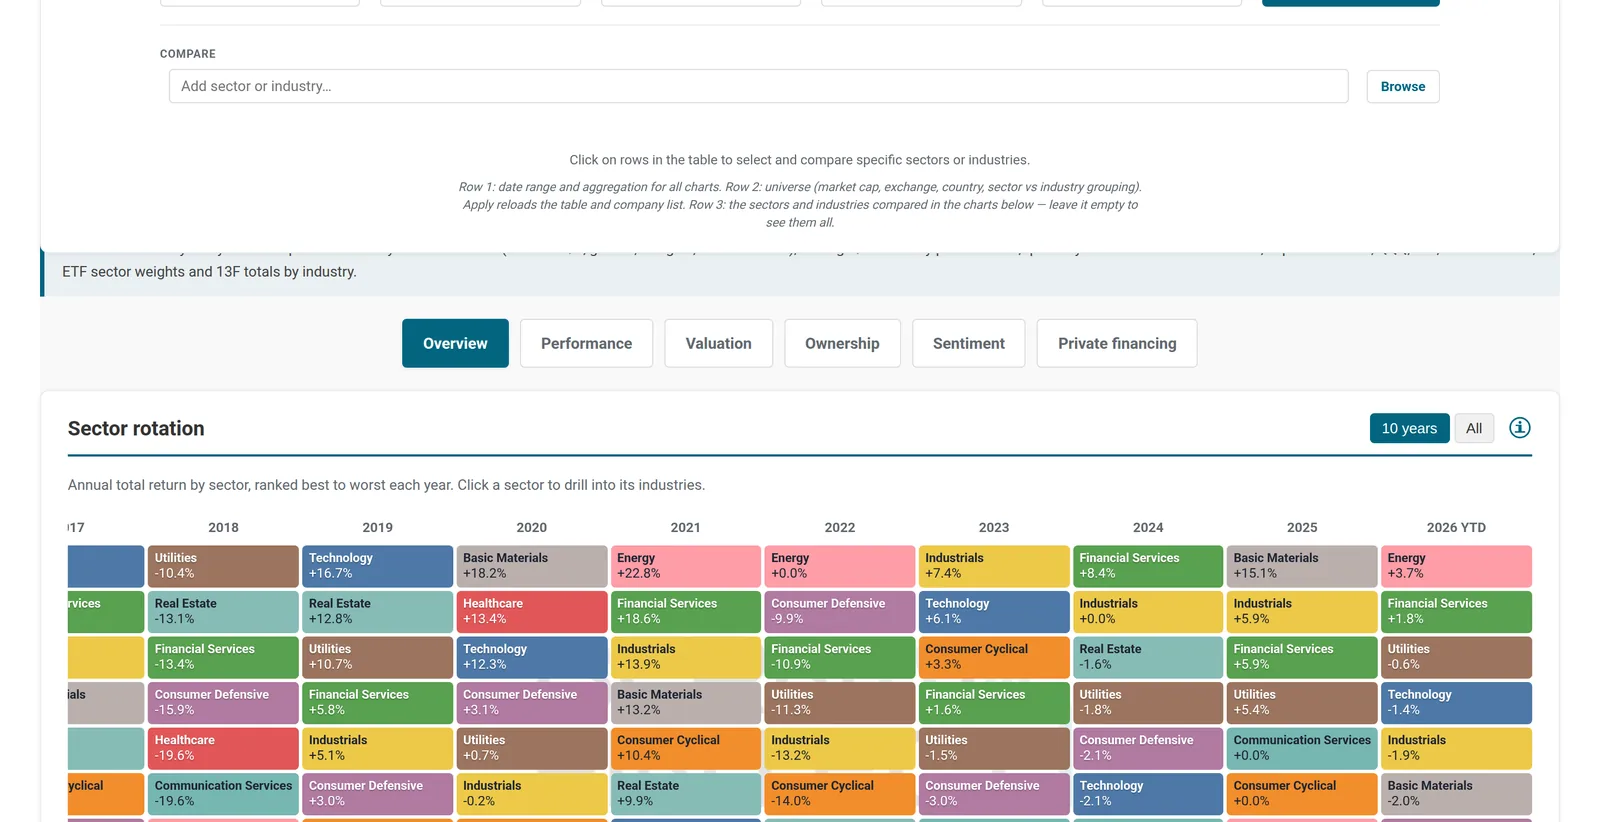
Sector and industry dashboards to see where money is moving, and an ETF screener to act on it.
The data, plainly
End of day
The quote on screen is live; series and figures update after the close. Built for analysis and decisions, not for intraday trading.
No export
No CSV, Excel or API. The data licence does not allow it, so I say it here rather than after you pay.
Your decision
Models, measures and scenarios — never a buy recommendation. What to do with the number stays with you.
No free plan
Subscriptions fund the platform. There is an individual demo of a few days to try it first, no card.
Try it before you pay.
Ask for a demo and look around with your own candidates on the screen.